Position Dashboard
Product
Dashboard is a complex server technology and a frontend map application for aggregation and visualization of data in time and space.
It receives and processes data through pre-defined aggregation functions on an ongoing basis.
Data are presented in a map interface in form of visualization of aggregated data reports in space for the selected time period including history.
1. Dashboard typical applications

- Geomarketing analyses.
- Sales support.
- Monitoring of technical and operation data.
- Source of data for management decision-making.
- Continuous collection of source data - ETL.
- Data are kept in safety within Dashboard technology.
- Online aggregation of data in time and space.
- Preparation of reports using aggregated data.
- Visualization in Dashboard web (or native) application.
- Address (X,Y coordinates) and the monitored value.
- Technical equipment - e.g. mobile operator BTS (traffic data...).
- Branch (point of sales, transactions...).
- Standard administrative classification (cadastral territories, municipalities, districts, regions).
- User regions (sales regions, technical regions such as RF planning regions etc.).
- Areas defined in other way (hexagonal grid, Voronoi diagrams).
- Standard functions such as number, sum, average, minimum, maximum.
- Incorporation of statistical data (by population, area, incomes...).
- Client-defined functions.
- Wide selection of report parameters - ADJUSTABILITY
- 100% owned SW solution - INDEPENDENCE AND FLEXIBILITY
- Own data centers - ENOUGH COMPUTING POWER
- Possibility of implementation of the whole solution into client's infrastructure - PORTABILITY
- No public services of third parties used - SAFETY
- Premium space data in the whole Europe, optional language versions - GLOBAL SOLUTION
- Verified solution - RELIABILITY
- Petr Mašek, Sales Manager
- mobilní telefon: +420 737 650 250

2. How it works?
3. What is the input information?
-
The input is a point information, for example:
4. What are the available forms of space aggregation?

5. What are the available types of reports?
6. Why Dashboard by Position?
Kontakt
Other products
Dashboard demo
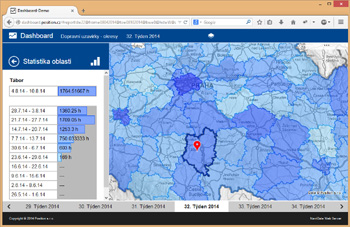
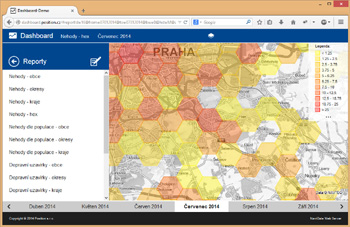
Demo application with the use of traffic data. The application makes use of Controls.js application framework. To visit the application click here: Position Dashboard demo.
Position Dashboard...Dashboard demo
- Dashboard demo works with information of traffic accidents, closures and road works (data from Czech national center JSDI).
- On-line aggregation is executed within the administrative structure of the Czech Republic (municipalities, districts, regions) and over the sample layer of hexagonal grid.
- Data layers may be viewed.
- Multiple languages supported.
- Authentication by demand.
- Frontend web application was developed using our own Controls.js JavaScript framework.
- Compatible with PCs, tablets and touchscreen mobile phones.
- Includes automatic GUI recognition for mobile and desktop/tablet version.
- Possibility of extension by a native mobile application.
- Dynamic legends.
- History graphs.
- Operated from Position data centers.
- The solution may be completely incorporated into client´s infrastructure.